
How can you pull significant information from websites fastly and efficiently? It takes a lot of time to extract the data manually. You can use web scraping, an automated method of acquiring non-tabular or poorly structured data from websites. Later, you can convert that data into a structured and usable format such as a spreadsheet
Table of Contents
- Why Is Web Scraping Used?
- Web Scraping Using Python Import LibrariesURL for Scraping DataScrape Every ElementUsing a LoopCreate a Pandas DataframeCreate Death_rate Column
- Import Libraries
- URL for Scraping Data
- Scrape Every Element
- Using a Loop
- Create a Pandas Dataframe
- Create Death_rate Column
- Web Scraping With Proxies
- Types of Proxies For Web Scraping
- Data Visualization With Python Import LibrariesPlotting a Pair PlotPlotting a Bar PlotPlotting a Scatter Plot Group and Sort the DataImport texttableCreate a texttable object
- Import Libraries
- Plotting a Pair Plot
- Plotting a Bar Plot
- Plotting a Scatter Plot
- Group and Sort the Data
- Import texttable
- Create a texttable object
- Conclusion
How can you pull significant information from websites fastly and efficiently? It takes a lot of time to extract the data manually. You can use web scraping, an automated method of acquiring non-tabular or poorly structured data from websites. Later, you can convert that data into a structured and usable format such as a spreadsheet or a .csv file.
Web scraping allows you to archive data and track data changes online. Businesses widely use it for different purposes. For instance, online stores use it to scrape their competitors’ price items and publicly available pages. Then, they use this information for adjusting their prices. Another common practice of web scraping is contact scraping, in which the organizations collect personal data like phone numbers or email addresses for marketing purposes.
Why Is Web Scraping Used?

Why does someone have to extract large amounts of information from websites? To understand this, look at the following applications of web scraping.
- Research and Development – You can collect large datasets ( Temperature, General Information etc.) from websites and analyze them to carry out surveys for research and development.
- Price Comparison – Businesses and services like ParseHub use web scraping to collect data from online shopping websites and compare products’ prices.
- Job Listings – You can use web scraping to collect details regarding job openings and interviews from different websites and list them in one place.
- Social Media Scraping – You can use web scraping to collect data from social media websites such as Instagram, Twitter and find out what’s trending.
- Email Address Gathering – Many companies use email as a medium for marketing. They use web scraping to collect email IDs and then send emails in bulk.
Web Scraping Using Python
You can scrape data from websites by following the below steps.
- Get the URL that you want to scrape
- Inspect the page
- Find the data you have to extract
- Write the code
- Run the code and extract the data
- Store the data in the desired format
The libraries that we can use for web scraping in Python are:
Pandas – Pandas is used to manipulate and analyze the data. You can use this library to extract the data and store it in the required format.
Beautiful Soup – It is a Python package to parse HTML and XML documents. It creates parse trees that are helpful in the easy extraction of data from websites.
Requests – It is a simple HTTP library.

We will be using this site for extracting the number of COVID cases. Afterwards, we will analyze the data and create some visualizations.
Import Libraries
You can import requests and BeautifulSoup in Python for web scraping, as shown below.
import requests
from bs4 import BeautifulSoup
URL for Scraping Data
Specify the website URL from which you have to scrape the data. You have to use requests.get() method to send a GET request to the specified URL. Further, you have to create a BeautifulSoup constructor that will take the two string arguments as shown in the below code.
url = 'https://www.worldometers.info/coronavirus/countries-where-coronavirus-has-spread/'
page = requests.get(url)
soup = BeautifulSoup(page.text, 'html.parser')

data = []
Scrape Every Element
You can scrape every element in the URL’sURL’s table by using soup.find_all() method. It returns an object that offers index-based access to the found occurrences and can be printed using a for or while loop.
data_iterator = iter(soup.find_all('td'))Using a Loop
You can use a while True loop that keeps repeating till there is data available in the iterator.
while True:
    try:
        country = next(data_iterator).text
        confirmed = next(data_iterator).text
        deaths = next(data_iterator).text
        continent = next(data_iterator).text
For the columns “confirmed” and “deaths”, make sure to remove the commas and convert to int.
data.append((
            country,
            (confirmed.replace(', ', '')),
            (deaths.replace(',', '')),
            continent
        ))

    except StopIteration:
        break
When the number of elements left to iterate through is zero, the StopIteration error will be raised.
Create a Pandas Dataframe
You can extract the data from the website after running the above code. You have to create a Pandas dataframe to analyze the data further. In the code below, we sorted the data by the number of confirmed COVID cases.
Import the pandas library to create a dataframe.
data.sort(key = lambda row: row[1], reverse = True)
import pandas as pd
df = pd.DataFrame(data,columns=['country','Number of cases','Deaths','Continent'],dtype=float)
df.head()
df['Number of cases'] = [x.replace(',', '') for x in df['Number of cases']]
df['Number of cases'] = pd.to_numeric(df['Number of cases'])
df
You will get the below output:
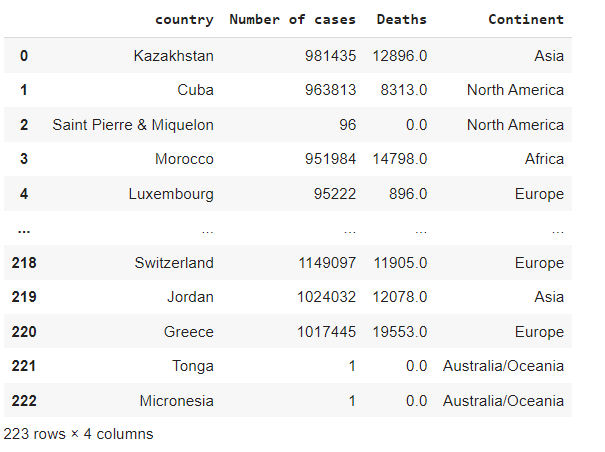
To get information about Dataframe, use df.info().
df.info()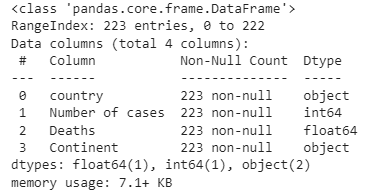
Create Death_rate Column
We will create a new column named Death_rate as shown below.
dff = df.sort_values(by ='Number of cases',ascending = False)
dff['Death_rate'] = (dff['Deaths']/dff['Number of cases'])*100
dff.head()
The output is as.

Web Scraping With Proxies
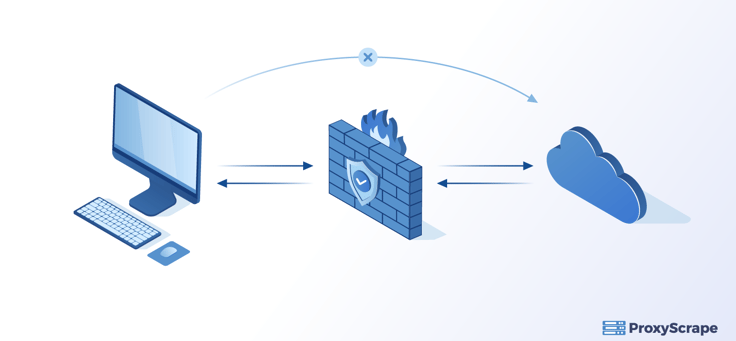
A proxy server allows you to use a unique IP address for accessing the information you’d like to scrape. This way, the website does not see your actual IP address allowing you to scrape data anonymously. You have to use proxies for web scraping because of the following reasons.
- You can send multiple simultaneous requests to a web server without getting banned using a pool of proxies.
- With the help of proxies, you can make requests from a particular location, device, ISP, mobile network. You can also crawl content displayed for a specific area or device.
- Some websites have IP bans, and you can circumvent them with the help of proxies.
Types of Proxies For Web Scraping

You can use the below two proxies to scrape data from websites.
- Datacenter proxies – Datacenter IP addresses are the server IP addresses. The servers are located in data centers. The main aim of the datacenter proxies is to hide your address from the websites you crawl. These proxies are primarily used to scrape business data.
- Residential Proxies – Residential IP addresses are expensive than the datacenter IPs and are hard to get. These proxies allow you to choose a specific location i-e., city, country etc. and surf the web as a real user in that geographical area.
Data Visualization With Python
You know that data visualization is the graphical representation of data or information. You can use visual tools like charts, maps, and graphs as an accessible way of understanding the represented data. Let’s see how we can visualize the extracted data from this website using data visualization tools.

Import Libraries
You have to import the following libraries for visualizing the data as shown below.
import seaborn as sns
import matplotlib.pyplot as plt
from pylab import rcParams
Plotting a Pair Plot
You can plot a pair plot to demonstrate pairwise relationships in a dataset. You can easily implement it by using the code below and can identify trends in the data for follow-up analysis.
rcParams['figure.figsize'] = 15, 10
from matplotlib.pyplot import figure
figure(num=None, figsize=(20, 6), dpi=80, facecolor='w', edgecolor='k')
sns.pairplot(dff,hue='Continent')
You will get the output as.

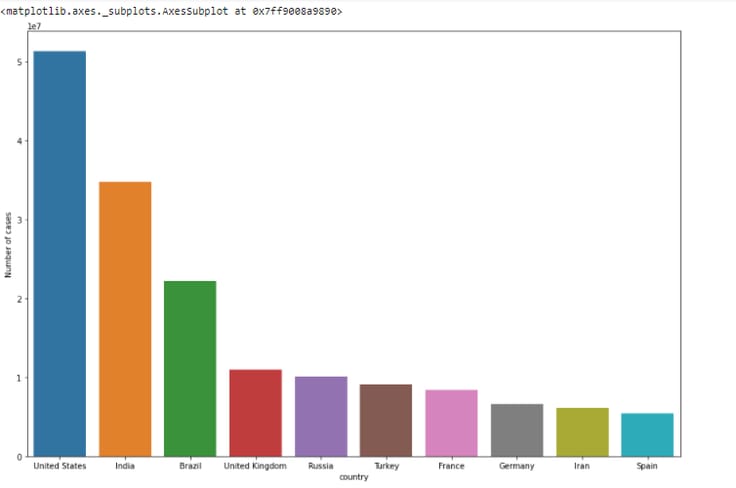
Plotting a Bar Plot
You can plot a bar plot that shows categorical data as rectangular bars and compares the values of different categories in the data.
sns.barplot(x = 'country',y = 'Number of cases',data = dff.head(10))The output is as.
Plotting a Scatter Plot
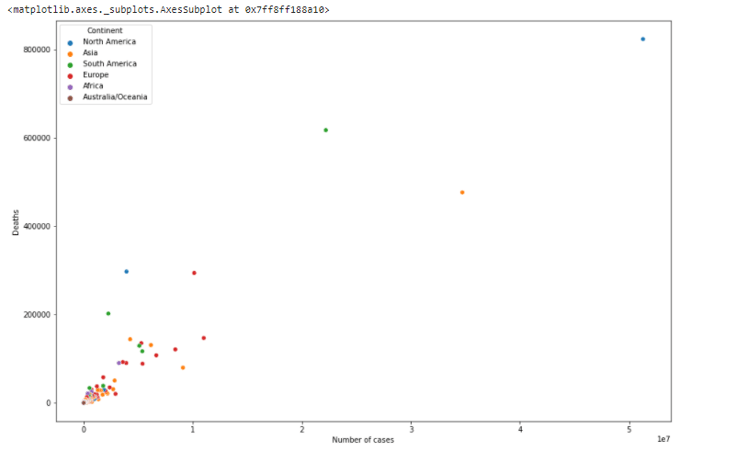
You can understand the relationship between numerical values using a scatter plot. It uses dots to represent the relationship between variables.
sns.scatterplot(x = "Number of cases", y = "Deaths",hue = "Continent",data = dff)The output is as.
Group and Sort the Data
In the code below, we will group the data by Continent and sort it by the number of COVID cases.
dfg = dff.groupby(by = 'Continent',as_index = False).agg({'Number of cases':sum,'Deaths':sum})
dfgg = dfg[1:]
df1 = dfgg.sort_values(by = 'Number of cases',ascending = False)
df1['Death_rate'] = (df1['Deaths']/df1['Number of cases'])*100
df1.sort_values(by = 'Death_rate',ascending = False)
The output is as.

Now, we will plot a bar plot between “Continent” and “Death_rate” as shown below.
sns.barplot(x = 'Continent',y = 'Death_rate',data = df1.sort_values(by = 'Death_rate',ascending = False))The output is as.
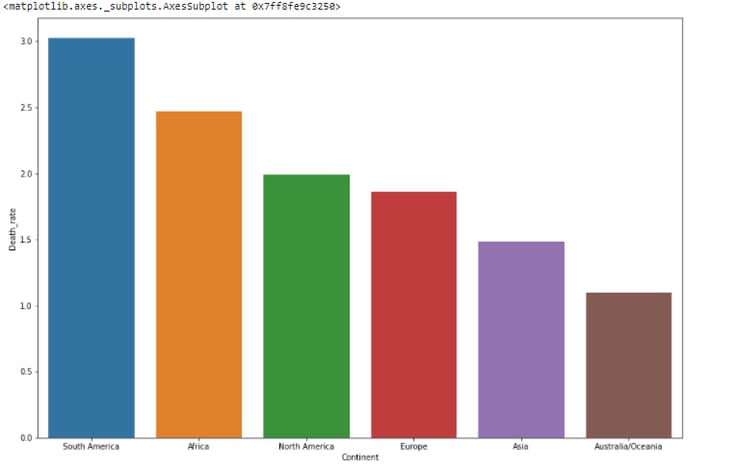
This bar plot shows that the death rate is the highest in South America and lowest in Australia among all countries.
Import texttable
Install texttable for creating a simple ASCII table. Then, import it as tt.
!pip install texttable

import texttable as tt
Create a texttable object
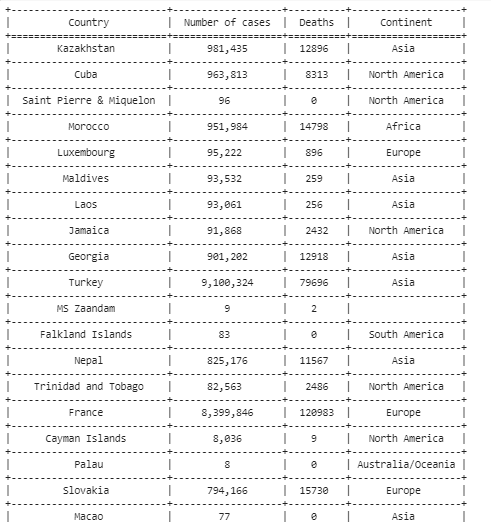
You have to create a texttable object as shown below. You have to add an empty row at the beginning of the table for the headers and align the columns.
table = tt.Texttable()

table.add_rows([(None, None, None, None)] + data)  table.set_cols_align(('c', 'c', 'c', 'c'))  # 'l' denotes left, 'c' denotes center, and 'r' denotes right
table.header((' Country ', ' Number of cases ', ' Deaths ', ' Continent '))

print(table.draw())
Here, the output represents some of the rows of the table as.
Conclusion
With web scraping, you can extract large amounts of data from websites fastly and efficiently. You can convert the extracted unstructured data into a usable format like a .csv file. We saw we can scrape the data from the web by using two modules i-e., Pandas and BeautifulSoup. Proxies allow you to extract the data from the web anonymously. You can use either datacenter or residential proxies for web scraping. The residential proxies are more reliable but expensive than datacenter proxies. Further, we can do data analysis to derive insightful information based on our needs. In this article, we analyzed the data by using data visualization tools such as bar plots, pair plots, and scatter plots.