


Web scraping is the art of extracting data from the internet and using it for meaningful purposes. It is also sometimes known as web data extraction or web data harvesting. For newbies, it is just the same as copying data from the internet and storing it locally. However, it is a manual process. Web scraping
Web scraping is the art of extracting data from the internet and using it for meaningful purposes. It is also sometimes known as web data extraction or web data harvesting. For newbies, it is just the same as copying data from the internet and storing it locally. However, it is a manual process. Web scraping is an automated process that works with the help of web crawlers. Web crawlers connect to the internet using HTTP protocol and allow the user to fetch data in an automated fashion. One may consider the internet as enriched soil and data as the new oil, while web scraping is the technique to extract that oil.
The ability to scrape and analyze the data from the internet has become an essential technique whether you are a data scientist, engineer, or marketer. There might be various use cases in which web scraping might be of massive help. In this article, we will scrape data from Amazon using Python. Finally, we will also analyze the scraped data and see how important it is for any normal person, data scientist, or person running an e-commerce store.
Just a little precaution: If you are new to Python and web scraping, this article might be a little bit harder for you to understand. I would suggest going through the introductory level articles at ProxyScrape and then come to this one.
Let’s get started with the code.
Importing Libraries
First of all, we will be importing all the necessary libraries required for the code. These libraries will be used for scraping and visualizing data. If you want to know the details of each one, you can visit their official documentation.
import pandas as pd
import numpy as np
import matplotlib.pyplot as plt
import seaborn as sns
%matplotlib inline
import re
import time
from datetime import datetime
import matplotlib.dates as mdates
import matplotlib.ticker as ticker
from urllib.request import urlopen
from bs4 import BeautifulSoup
import requests
Scraping Amazon Data
Now we will scrape the useful information from the Amazon best-selling books. The URL we are going is to scrape is:
https://www.amazon.in/gp/bestsellers/books/ref=zg_bs_pg_’+str(pageNo)+’?ie=UTF8&pg=’+str(pageNo)
Since we need to access all the pages, we will loop through each page to get the necessary dataset.
For connecting to the URL and fetching the HTML content, the following is required,
- get_data: this function will be used for inputting the page no as an argument.
- user-agent: it will help in bypassing the detection.
- We will specify the URL to request.get and pass the user-agent as an argument.
- Extracting the content from requests.get.
- Scrape the specified page and assign it to the soup variable.
Some of the important tags under which our important data will reside are,
- Book Name
- Author
- Rating
- Customers Rated
- Price
If you inspect the given page, you will see the parent tag and its corresponding elements.
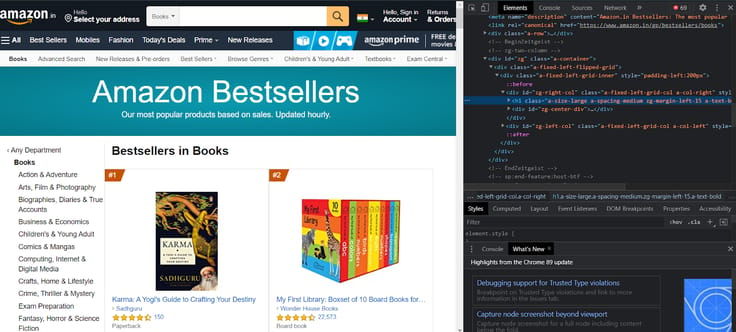
If you want to inspect a particular attribute, go to each one of them and inspect them. You will find some important attributes for the author, book name, rating, price, customers rated.
In our code, we will be using nested if-else statements to apply extra findings for those authors who are not registered with amazon.
no_pages = 2

def get_data(pageNo):
    headers = {"User-Agent":"Mozilla/5.0 (Windows NT 10.0; Win64; x64; rv:66.0) Gecko/20100101 Firefox/66.0", "Accept-Encoding":"gzip, deflate", "Accept":"text/html,application/xhtml+xml,application/xml;q=0.9,*/*;q=0.8", "DNT":"1","Connection":"close", "Upgrade-Insecure-Requests":"1"}

    r = requests.get('https://www.amazon.in/gp/bestsellers/books/ref=zg_bs_pg_'+str(pageNo)+'?ie=UTF8&pg='+str(pageNo), headers=headers)#, proxies=proxies)
    content = r.content
    soup = BeautifulSoup(content)
    #print(soup)

    alls = []
    for d in soup.findAll('div', attrs={'class':'a-section a-spacing-none aok-relative'}):
        #print(d)
        name = d.find('span', attrs={'class':'zg-text-center-align'})
        n = name.find_all('img', alt=True)
        #print(n[0]['alt'])
        author = d.find('a', attrs={'class':'a-size-small a-link-child'})
        rating = d.find('span', attrs={'class':'a-icon-alt'})
        users_rated = d.find('a', attrs={'class':'a-size-small a-link-normal'})
        price = d.find('span', attrs={'class':'p13n-sc-price'})

        all1=[]

        if name is not None:
            #print(n[0]['alt'])
            all1.append(n[0]['alt'])
        else:
            all1.append("unknown-product")

        if author is not None:
            #print(author.text)
            all1.append(author.text)
        elif author is None:
            author = d.find('span', attrs={'class':'a-size-small a-color-base'})
            if author is not None:
                all1.append(author.text)
            else:
                all1.append('0')

        if rating is not None:
            #print(rating.text)
            all1.append(rating.text)
        else:
            all1.append('-1')

        if users_rated is not None:
            #print(price.text)
            all1.append(users_rated.text)
        else:
            all1.append('0')

        if price is not None:
            #print(price.text)
            all1.append(price.text)
        else:
            all1.append('0')
        alls.append(all1)
    return alls
This will perform the following functions,
- Collect the data inside a for loop.
- The loop will iterate over each page, starting from 1 to page+1.
- We need first to flatten the list and then pass it to DataFrame.
- We will finally save the dataframe as a CSV file.
for i in range(1, no_pages+1):
    results.append(get_data(i))
flatten = lambda l: [item for sublist in l for item in sublist]
df = pd.DataFrame(flatten(results),columns=['Book Name','Author','Rating','Customers_Rated', 'Price'])
df.to_csv('amazon_products.csv', index=False, encoding='utf-8')
Reading the CSV File
We will now load the csv file,
df = pd.read_csv("amazon_products.csv")
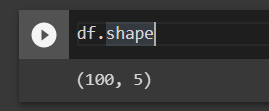
df.shapeThe shape of the dataframe shows that there are 100 rows and 5 columns in the CSV file.
Let’s see the 5 rows of the dataset,
df.head(61)
We will now do some preprocessing on ratings, customers_rated, and price column.
- Since ratings are out of 5, we will remove the extra part from it.
- We will remove commas from the customer_rated column.
- In the price column we will remove the rupees symbol and split it by dot.
- Lastly, we will convert all three columns into integer or float.
df['Rating'] = df['Rating'].apply(lambda x: x.split()[0])
df['Rating'] = pd.to_numeric(df['Rating'])
df["Price"] = df["Price"].str.replace('₹', '')
df["Price"] = df["Price"].str.replace(',', '')
df['Price'] = df['Price'].apply(lambda x: x.split('.')[0])
df['Price'] = df['Price'].astype(int)
df["Customers_Rated"] = df["Customers_Rated"].str.replace(',', '')
df['Customers_Rated'] = pd.to_numeric(df['Customers_Rated'], errors='ignore')
df.head()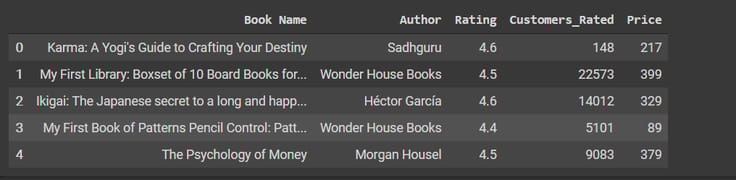
If we have a look on the types of dataframe we get,
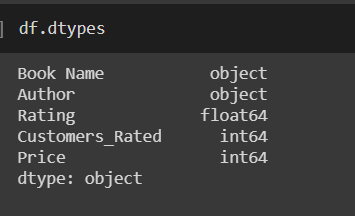
There is some incomplete information in the output above. We will first count the number of NaNs and then drop them.
df.replace(str(0), np.nan, inplace=True)
df.replace(0, np.nan, inplace=True)
count_nan = len(df) - df.count()
count_nan
df = df.dropna()Highest Priced Books of Authors
We will now get to know all authors with the highest-priced book. We will get familiar with the top 20 from them.
data = data.sort_values(['Rating'],axis=0, ascending=False)[:15]
data
Top Rated Books
We will now see the top-rated books and authors with respect to customer-rated. We will filter out those authors and books with less than 1000 reviews, so we get the most famous authors.
data = df[df['Customers_Rated'] > 1000]
data = data.sort_values(['Rating'],axis=0, ascending=False)[:15]
data
Let’s visualize the top rated books,
p = figure(x_range=data.iloc[:,0], plot_width=800, plot_height=600, title="Top Rated Books with more than 1000 Customers Rating", toolbar_location=None, tools="")

p.vbar(x=data.iloc[:,0], top=data.iloc[:,2], width=0.9)

p.xgrid.grid_line_color = None
p.y_range.start = 0
p.xaxis.major_label_orientation = math.pi/2
show(p)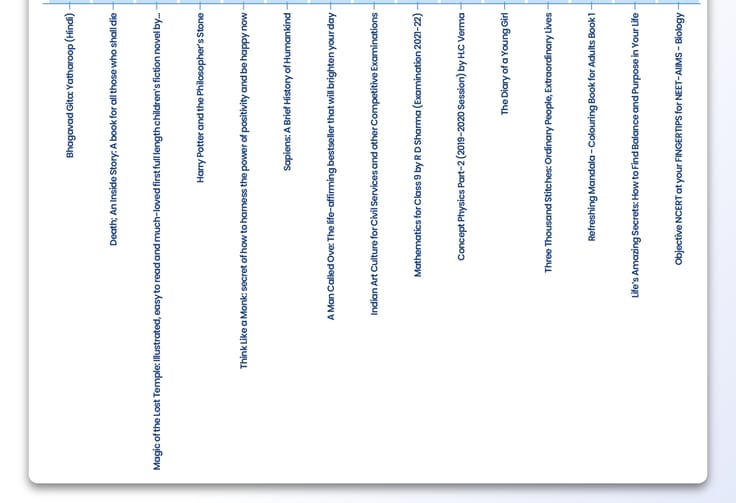
Most Rated Authors and Books by Customers
The more the ratings, the better the customer trust. So it will be more convincing and credible if we add the authors and books that are most rated by the customers.
from bokeh.transform import factor_cmap
from bokeh.models import Legend
from bokeh.palettes import Dark2_5 as palette
import itertools
from bokeh.palettes import d3
#colors has a list of colors which can be used in plots
colors = itertools.cycle(palette)

palette = d3['Category20'][20]
index_cmap = factor_cmap('Author', palette=palette,
                         factors=data["Author"])
p = figure(plot_width=700, plot_height=700, title = "Top Authors: Rating vs. Customers Rated")
p.scatter('Rating','Customers_Rated',source=data,fill_alpha=0.6, fill_color=index_cmap,size=20,legend='Author')
p.xaxis.axis_label = 'RATING'
p.yaxis.axis_label = 'CUSTOMERS RATED'
p.legend.location = 'top_left'

show(p)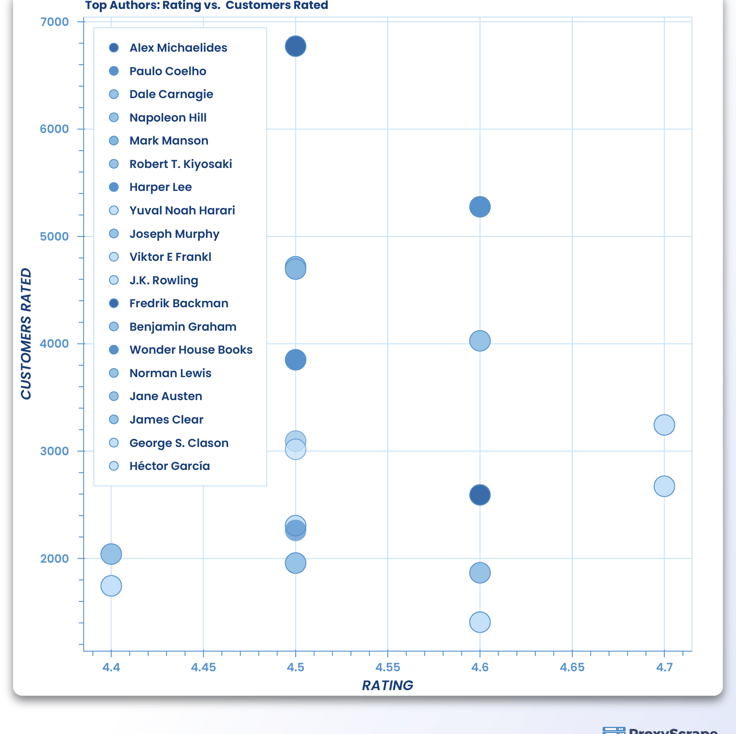
Wrapping Up
In this article, we have seen what web scraping is by taking a very important use case of extracting data from Amazon. We have not only extracted data from different amazon pages, but we have also visualized the data using different Python libraries. This article was an advanced-level article and might be hard to understand for people who are new to web scraping and data visualization. For them, I would suggest going to the starter pack articles available at ProxyScrape. Web scraping is a very useful technique that can give a boost to your business. There are also some amazing paid tools available in the market, but why pay them when you can code your own scraper. The code we have written above might not work for every webpage because the page structure might differ. But if you have understood the concepts above, then there are no hurdles for you to scrape any webpage by modifying the code according to its structure. I hope this article was interesting for the readers. That was all. See you in the next ones!